Health equity in organ donation: A Single OPO Review
Jeffrey P. Orlowski1, Rachael E Ketcham1, Jeff G Mathews1, Kimberly A Gillespie1, Jason M Morton1, Kathryn J Smith1, Clint A Hostetler1.
1LifeShare Network, Inc., Oklahoma City, OK, United States
Purpose: Recent editorials and articles published in the medical literature and in mainstream media have questioned health equity in organ donation, specifically that organ procurement organizations (OPOs) are less likely to respond to referrals of potential donors of racial minorities or approach those donors’ families for authorization. We sought to review our OPO’s practices in responding to referrals of various racial backgrounds.
Methods: Census data for Oklahoma defining the 2022 racial makeup of the general population, organ donors, transplant waitlist, transplant recipients, and waitlist candidates was obtained. Organ donor (ventilated) referrals, medical rule-outs (MRO) with and without COVID, on-site evaluations, approaches, authorization rates, and registry rates were analyzed for White, Black, Native American, and Hispanic/Latino populations for 2020 through 2022.
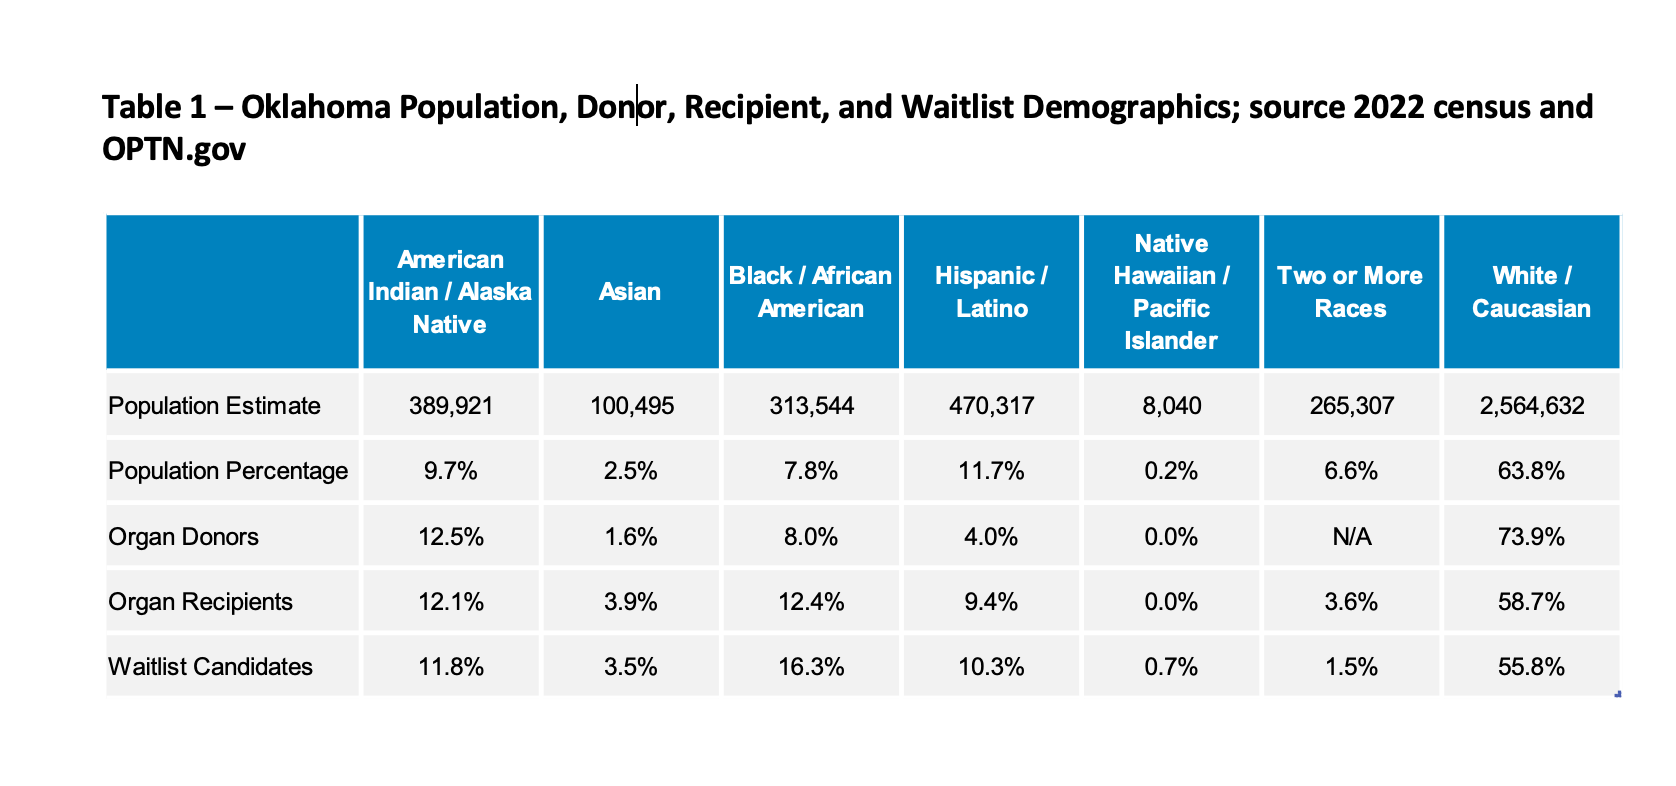
Results: The 2022 ethnic demographic breakdown of Oklahoma’s general population, donors, recipients, and waitlist is depicted in Table 1.

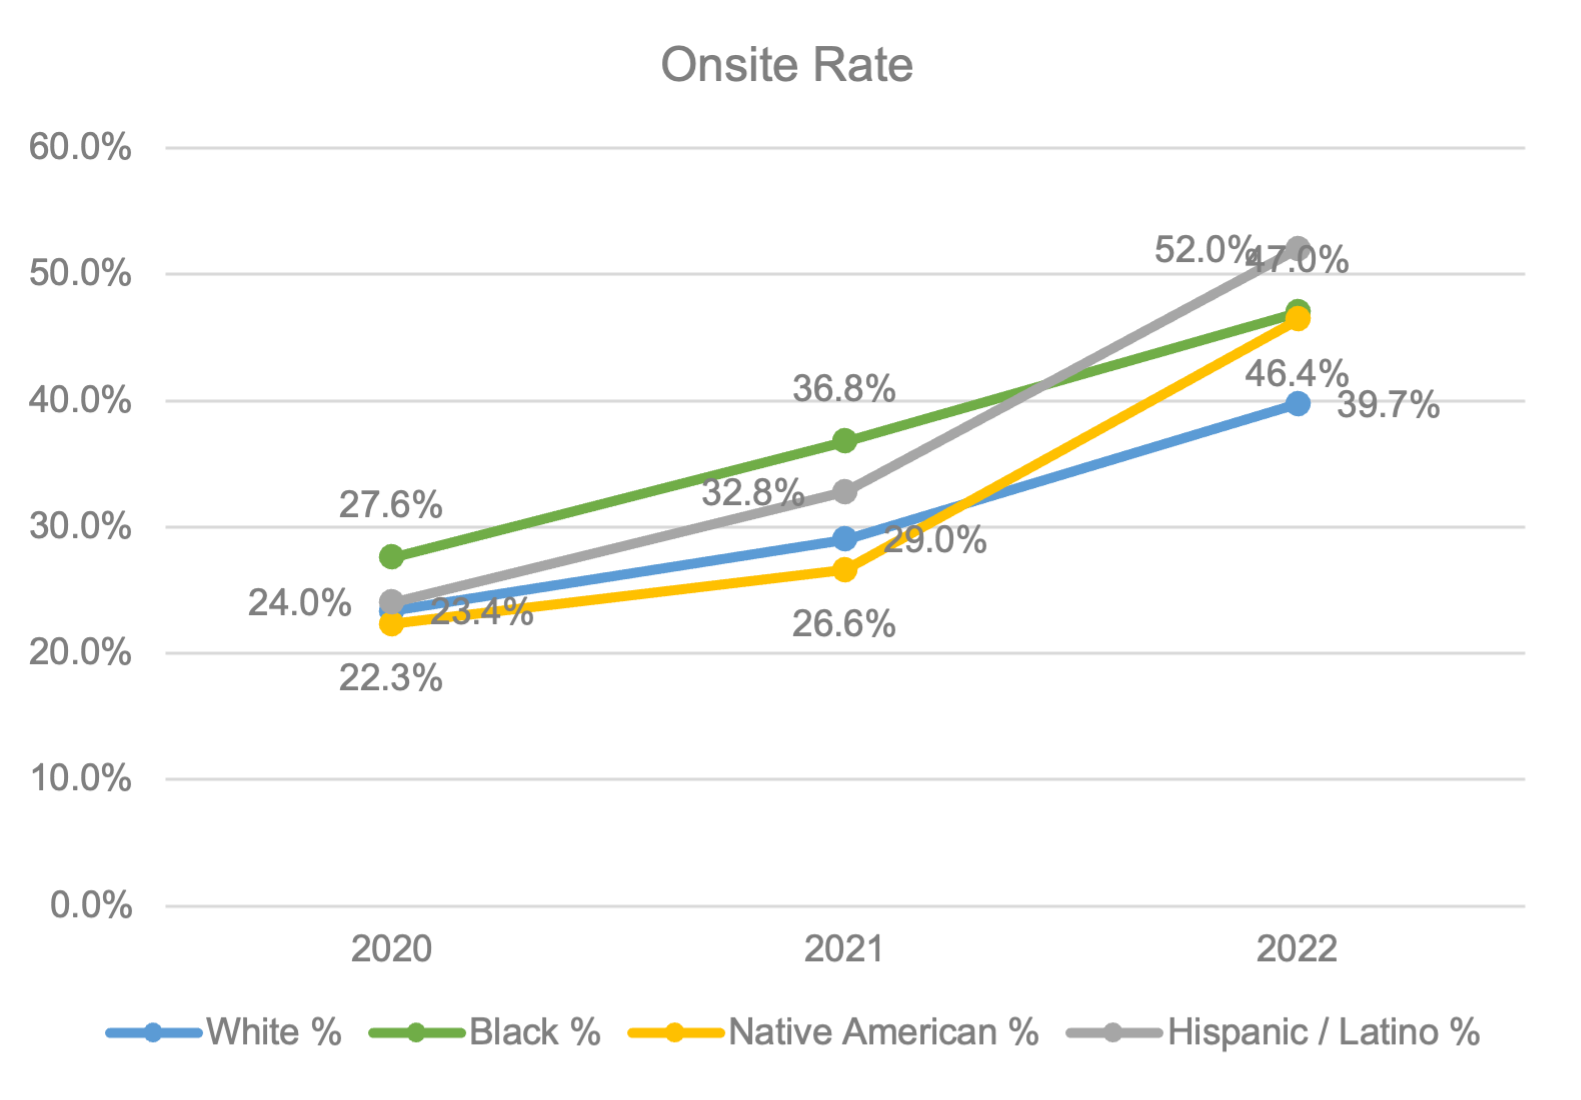
Referrals by race as a percentage of total referrals were, by year for 2020, 2021, and 2022: White = 76.8%, 76.5%, 77.2%; Black = 10.3%, 10.3%, 10.2%; Native American = 6.1%, 5.9%, 6.6%; and Hispanic/Latino = 5.4%, 5.9%, 4.8%. “Other” accounted for </= 1.5% combined. MRO excluding COVID decreased from 2020 to 2022 for White, Black, and Native American, and were 34.5%, 33.1%, and 33.8% in 2022; Hispanic/Latino MRO trended up but was lower than the other three groups in 2022 (25.7%). On-Site response rates by race as a percentage of total referrals for each race were, by year: White = 23.4%, 29.0%, 39.7%; Black = 27.6%, 36.8%, 47.0%; Native American = 22.3%, 26.6%, 46.4%; and Hispanic/Latino = 24.0%, 32.8%, 52.0%.

The percentage of all referrals of each race approached by years were: White = 9.9%, 8.0%, 9.4%; Black = 10.5%, 10.0%, 9.5%; Native American = 15.5%, 12.0%, 18.4%; Hispanic/Latino = 11.2%, 11.2%, 12.6%. Authorization rates by race and year were: White = 79.3%, 78.0%, 74.9%; Black = 51.1%, 59.7%, 53.7%; Native American = 65.9%, 69.8%, 73.1%; Hispanic/Latino = 65.4%, 65.0%, 47.1%. The percentage of approaches with first-person authorization by race and year were: White = 41.9%, 41.5%, 48.3%; Black = 29.8%, 19.4%, 18.5%; Native American = 48.8%, 32.6%, 43.3%; Hispanic/Latino = 34.6%, 20.0%, 20.6%.
Conclusions: Data show that in our OPO practice, MRO is essentially the same for White, Black, and Native American referrals with Hispanics/Latinos having a lower rate. On-site response rates were highest for Black referrals and all minorities had a higher response rate than Whites. Finally White and Black referrals are approached at a near identical rate with other minorities approached at a higher frequency. Our data do not indicate minority donors and donor families are underserved in our OPO service area. Further study to improve authorization and registry rates in the minority population are warranted.